
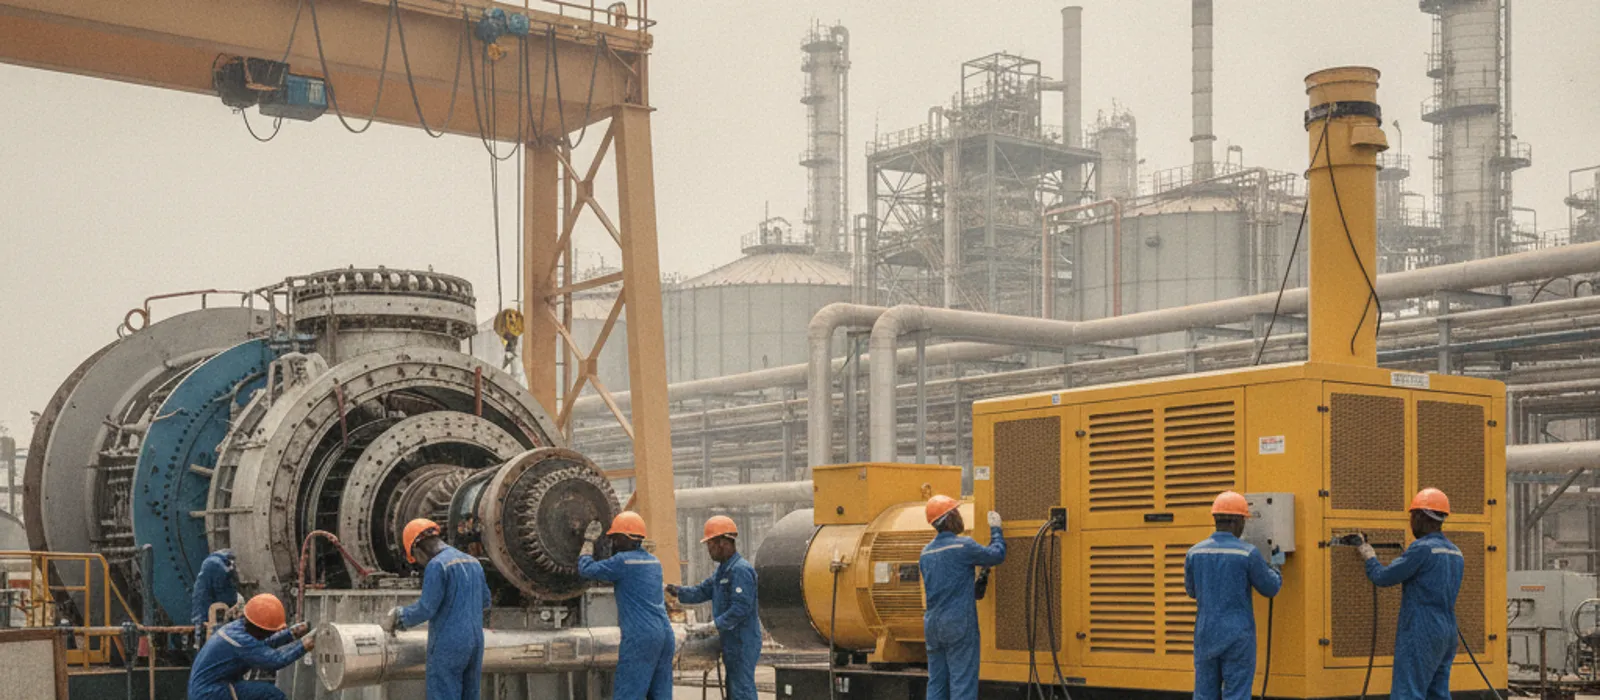
Suppose a 2.5 MW simple cycle gas turbine averages 41 percent load for most of the year, and the plant manager cannot work out why the cost per unit is nearly double what the feasibility study promised. Nothing is broken. The machine is simply being asked to do the one thing it does worst.
That is the argument buried inside every gas turbine vs diesel generator comparison. Nameplate efficiency is one point on a curve. What actually sets your cost per kWh over five years is how the machine behaves at the loads you really run, how it absorbs step changes, and how often it must come off line for inspection.
This article compares the three prime movers most Nigerian industrial sites are choosing between: the diesel generator, the reciprocating gas engine, and the simple cycle gas turbine. The figures below are indicative and depend on site conditions. Any of them can be wrong for your plant by 20 percent or more until someone measures your actual load profile.
What “behaves under load” actually means on a Nigerian site
Four characteristics decide whether a prime mover suits your plant, and none of them appear on the sales sheet as a single number.
The first is the part-load efficiency curve. Every machine burns more fuel per kWh as load falls, but the slope differs enormously between technologies. The second is transient response, meaning what happens to voltage and frequency when a 400 kW chiller or a large induction motor starts across the line.
The third is start time and start cost. A diesel set carries load in seconds. A gas turbine needs a purge cycle and a controlled run-up, and every start consumes equivalent operating hours against its inspection interval.
The fourth is derating. Ambient temperature, altitude, humidity and inlet air quality all remove output, and they remove far more from a turbine than from a reciprocating engine. In Kaduna or Kano during harmattan, this is not a rounding error.
If you are specifying plant now, get the load profile logged at one minute resolution for at least two normal production weeks before anyone quotes a machine. Request a technical proposal and we will scope the measurement first and the equipment second.
Gas turbine vs diesel generator: the part-load penalty decides most cases
At full load, a 1 MW to 2 MW diesel generator will reach roughly 38 to 42 percent electrical efficiency. A small simple cycle gas turbine in the 1 MW to 10 MW class reaches roughly 25 to 33 percent. The turbine is already behind before part load enters the discussion.
Drop both to half load and the gap widens sharply. The diesel loses perhaps three to five percentage points. The turbine can lose eight to ten, because its compressor still has to do most of its work regardless of how much fuel you are burning in the combustor.
At 25 percent load the small turbine is often below 17 percent efficiency. In fuel terms that means you are paying somewhere near double per kWh compared with the same machine at full output. This is why oversizing a turbine is expensive in a way that oversizing a diesel set is not, though both are mistakes.
The diesel has its own part-load failure mode, and it is mechanical rather than thermodynamic. Run a diesel below about 30 percent of rating for long periods and you get incomplete combustion, unburnt fuel and lubricating oil accumulating in the exhaust system, glazed bores and fouled turbochargers. This is wet stacking, and it shortens top end overhaul intervals badly. We cover the symptoms in more detail in generator low output causes.
So the honest version of gas turbine vs diesel generator is this. If your load is steady, large and continuous, and you can use the exhaust heat, the turbine becomes competitive. If your load swings, or the plant runs one shift, the diesel or the gas engine will beat it on whole life cost almost every time.
Gas engine vs diesel generator: where reciprocating gas sits
The gas engine is mechanically a close cousin of the diesel, and it keeps most of the diesel’s part-load behaviour. Efficiency at full load is broadly similar, in the 38 to 43 percent range for modern units in the 0.5 MW to 4 MW class, and the curve stays reasonably flat down to about 40 percent load.
What changes is fuel cost and transient response. Pipeline gas in Nigeria is far cheaper per unit of energy than automotive gas oil, which is the single largest reason gas engines are displacing diesel on continuous industrial duty around Lagos, Ota, Agbara and the Niger Delta corridor.
The trade off is that gas engines accept smaller step loads than diesels. A diesel set may take 50 to 70 percent of rating in one block depending on its class rating. A naturally aspirated or lean burn gas engine may only take 25 to 33 percent in one step without an unacceptable frequency dip, which matters if you start large motors direct on line.
Gas engines are also sensitive to gas quality. Methane number, wobbe index variation, hydrogen sulphide and moisture carryover all affect knock margin and valve life. Where supply is associated gas or the composition varies with the source, the engine needs gas conditioning and the derating must be calculated, not assumed.
The comparison table: what each technology costs to run
The figures below assume automotive gas oil at NGN 1,200 per litre (about USD 0.77) and pipeline gas at NGN 550 per standard cubic metre (about USD 0.35). Treat both as placeholders to replace with your own delivered price before using this table in a business case, because fuel pricing moves faster than equipment selection cycles.
| Characteristic | Diesel generator (0.5 to 2 MW) | Gas engine (0.5 to 4 MW) | Simple cycle gas turbine (1 to 10 MW) |
|---|---|---|---|
| Electrical efficiency at 100% load | 38 to 42% | 38 to 43% | 25 to 33% |
| Efficiency at 50% load | 35 to 38% | 36 to 39% | 18 to 24% |
| Efficiency at 25% load | 28 to 32% | 30 to 33% | 12 to 17% |
| Cold start to full load | 10 to 15 seconds | 1 to 3 minutes | 5 to 15 minutes with purge |
| Largest single step load | 50 to 70% of rating | 25 to 33% of rating | Large blocks, with frequency dip |
| Top end / hot gas path inspection | 8,000 to 12,000 hours | 20,000 to 30,000 hours | 8,000 to 12,000 equivalent hours |
| Major overhaul interval | 15,000 to 20,000 hours | 60,000 to 80,000 hours | 24,000 to 36,000 equivalent hours |
| Exhaust temperature / CHP value | 450 to 500 °C, moderate | Jacket water plus exhaust, good | 480 to 550 °C, excellent |
| Indicative fuel cost at full load | NGN 336 per kWh (USD 0.22) | NGN 138 per kWh (USD 0.09) | NGN 209 per kWh (USD 0.13) |
| Indicative fuel cost at 45% load | NGN 396 per kWh (USD 0.25) | NGN 158 per kWh (USD 0.10) | NGN 302 per kWh (USD 0.19) |
| Main derating sensitivity | Ambient and altitude, moderate | Gas quality and methane number | Ambient temperature and inlet dust, high |
Note the last row. A small gas turbine typically loses between 0.5 and 0.9 percent of output for every degree Celsius above the ISO reference of 15 °C. On a 34 °C afternoon in Port Harcourt that is a meaningful loss of firm capacity, and it has to be designed in rather than discovered in commissioning.
Equivalent operating hours matter too. Turbine inspection intervals are counted in equivalent hours, where each start can count as anything from 10 to 20 running hours depending on the frame and the start profile. A peaking duty turbine reaches its hot gas path inspection far sooner than its calendar hours suggest, which we explain in turbine inspection intervals.
Three scenarios and what the numbers look like
Worked example (hypothetical): a mid-sized site on a two-shift pattern. Connected load 3.2 MW, measured average demand 1.9 MW across two shifts, roughly 6,000 running hours per year. The site has a 2.5 MW simple cycle turbine selected on peak demand rather than on the load duration curve.
Measured gas consumption comes out at about 0.43 standard cubic metres per kWh. Two 1.2 MW gas engines in lead and lag configuration would run near 0.25 SCM per kWh, roughly 40 percent less gas for the same output. Across 11.4 million kWh a year that gap is a substantial fuel saving, and it needs to be weighed against the capital cost of the engine plant using our cost guide or a proposal scoped to the site. The turbine remains useful as standby and for the peak shift.
Worked example (hypothetical): a site with a steady overnight base load. Peak demand 850 kW, overnight base load about 300 kW, served by two 1,000 kVA diesel sets. At night one set carries roughly 33 percent load for eight to ten hours.
Specific fuel consumption at that load measures near 0.34 litres per kWh against 0.27 at three quarter load, a real fuel penalty on night running alone, before counting the injector fouling and early top end work the wet stacking causes. A correctly sized smaller night set typically pays back within a year or two and takes the large sets out of a duty they were never suited to. Sizing logic is set out in the generator sizing guide.
Worked example (hypothetical): a site needing continuous process steam and power. The site needs about 4 tonnes per hour of process steam as well as 2.2 MW of electrical load, continuously. Here the turbine wins, and it is not close.
Turbine exhaust at roughly 510°C into a heat recovery steam generator raises fuel utilisation from about 29 percent electrical only to 65 to 72 percent combined. The steam that would otherwise come from a separate gas fired boiler is now far cheaper in fuel terms. The condition is that the electrical and steam demands must both be genuinely continuous, and the inlet filtration has to be specified for harmattan conditions, which is a real design item rather than a catalogue option. See harmattan dust turbine derating for what that season does to compressor fouling.
If your site profile looks like any of these three, book a plant assessment and we will model the load duration curve against each option before recommending equipment.
Making the decision without a feasibility study you cannot verify
Work through it in this order. Establish the load duration curve first, because it tells you what percentage of hours the plant spends in each load band, and that single chart eliminates most options on its own.
Then price delivered fuel at the site boundary, including any gas connection or pressure reduction work, and any diesel logistics and storage losses. Then apply the derating for your ambient conditions, altitude and inlet air quality, rather than accepting ISO ratings.
Only then compare capital cost, and compare it over the same period as the maintenance schedule. A turbine major at 30,000 equivalent hours and a diesel major at 18,000 running hours are not comparable events, and lumping them into a generic percentage of capex per year hides the real cash timing.
Solar PV with storage belongs in this calculation as a fuel saver, not as a prime mover. On a site with roof area and a daytime demand peak it will cut annual diesel consumption meaningfully, but output on a heavy harmattan day falls well below clear sky expectations and module soiling costs further yield between cleans. It does not remove the need for firm capacity unless the storage is sized for the full outage duration you need to survive.
Captive generation above the threshold set by the regulator also requires a permit. The Nigerian Electricity Regulatory Commission publishes the current captive generation requirements, and comparative heat rate data by technology is available from the U.S. Energy Information Administration.
Some of this work needs an engineer on site with instruments. Gas path analysis, vibration baselining and combustion tuning are not desk exercises, and a turbine hot gas path inspection needs a planned outage window with lifting equipment and clean conditions. Our approach to that scoping is set out under power plant audit and generator maintenance, and indicative cost structures under generator and turbine maintenance cost.
For a comparison of running costs on the diesel side specifically, see diesel generator cost per kWh.
If you are at the stage of comparing written proposals, request a technical proposal and we will put the load data, the derating calculation and the maintenance schedule in one document you can hand to procurement.
Frequently Asked Questions
Is a gas turbine always more efficient than a diesel generator?
No, and for the sizes most Nigerian industrial sites use it is usually the other way round. A 1 MW to 10 MW simple cycle gas turbine typically runs at 25 to 33 percent electrical efficiency against 38 to 42 percent for a diesel set of similar output. The turbine only pulls ahead when its exhaust heat is recovered for steam or absorption chilling, or at much larger frame sizes in combined cycle.
What is the minimum load a diesel generator should run at?
As a working rule, avoid sustained running below about 30 percent of rating, and target 50 to 80 percent where you can. Below that band you risk wet stacking, bore glazing and turbocharger fouling, which brings top end overhauls forward. If your night or weekend load is genuinely small, a correctly sized smaller set is cheaper than repeatedly load banking the large one.
How much output does a gas turbine lose in Nigerian ambient conditions?
Expect roughly 0.5 to 0.9 percent of output lost per degree Celsius above the ISO reference of 15 °C, so a 35 °C day can remove 10 to 18 percent of nameplate capacity. Dust loading during harmattan adds compressor fouling losses on top of that. The exact figure depends on the frame, the inlet filtration and the site, so it should be calculated for your location rather than estimated from a datasheet.
Can we convert an existing diesel generator to run on gas?
Dual fuel conversion is possible on some engine families, and it can displace a share of the diesel with gas while keeping compression ignition. Full conversion to a spark ignited gas engine is a different matter and is rarely economic on an existing diesel block. The decision depends on the engine make, its remaining life, gas composition and pressure at the site, so it needs an inspection and an engine specific assessment before any figure is quoted.