
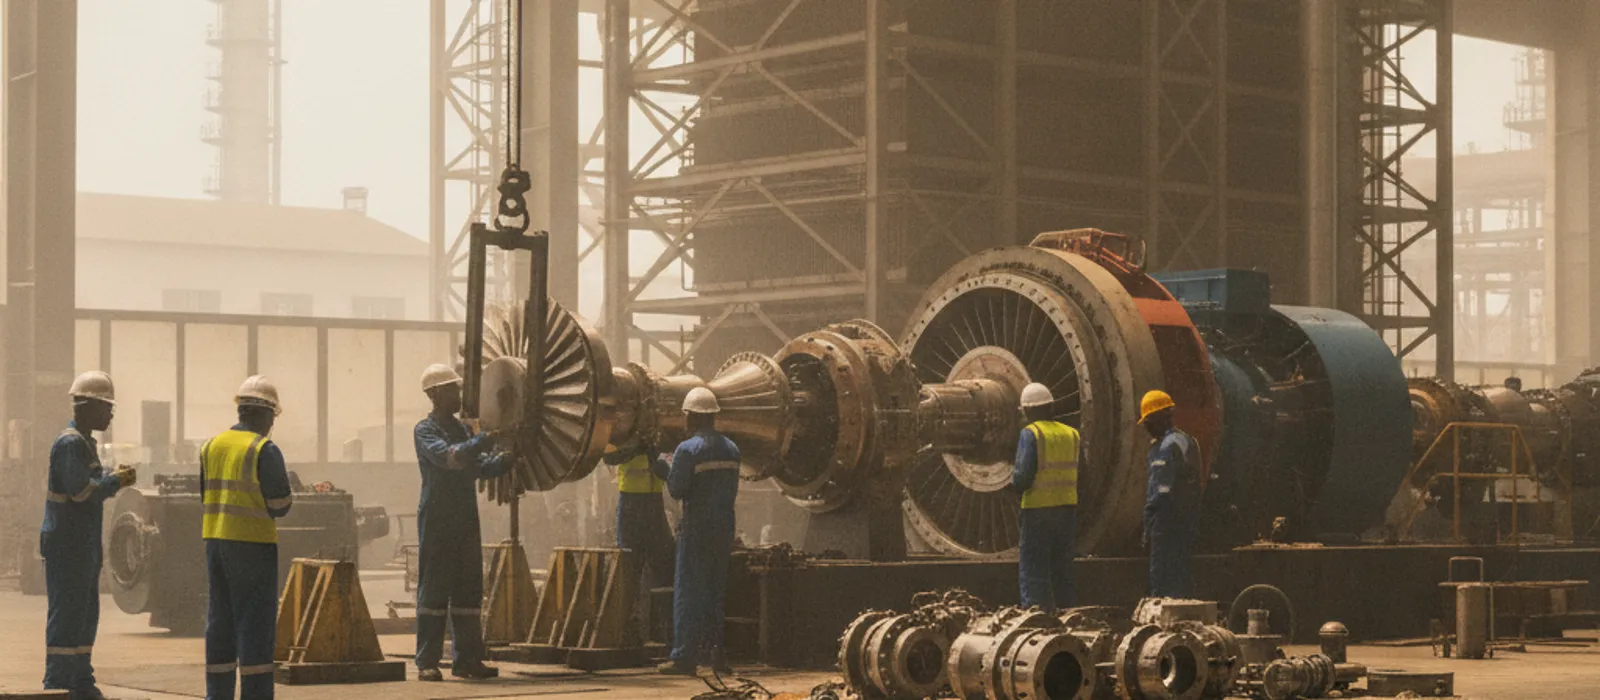
Take a 2.5 MW gas turbine that trips and is back on load two and a half hours later. The maintenance log records two and a half hours lost. Finance can reconcile the same event at several times that simple figure once every affected line is added up, and most of the added cost has nothing to do with the turbine itself.
The cost of unplanned downtime per hour is the most useful single number a plant can hold, and it is the number most plants cannot produce when asked for it. Without it, every maintenance decision becomes an argument about a spend figure with nothing on the other side of the scale. With it, a spares holding decision or a redundancy proposal takes about ten minutes to settle.
This article sets out how the number is built, why it is almost never linear across hours, and what three very different Nigerian plants actually work out at.
Why the Cost of Unplanned Downtime per Hour Is Almost Always Understated
The usual estimate is annual revenue divided by annual operating hours. That figure is wrong in both directions at once, and it is wrong by a lot.
It is too high because revenue is not margin. An hour of stopped production does not destroy the raw material cost, the packaging, the freight or the variable power that would have been consumed. What you actually lost is contribution margin, which on most Nigerian processing lines sits between 18 and 40 percent of revenue.
It is too low because it counts nothing that happens outside the production line. Labour still gets paid, product still spoils, resin still freezes in the barrel, the boiler still has to be re-warmed, and a bearing that was damaged during the coast down still has to be replaced. On plants with a restart penalty, the excluded lines are frequently larger than the lost margin itself.
There is a third error that is harder to see. Averaging the cost across all hours flattens out exactly the information that matters, because a cold store loses almost nothing in hour two and can lose a year of profit in hour eleven.
If you want this worked properly against your own production and cost data before your next budget cycle, request a technical proposal and we will scope a downtime costing exercise alongside a power plant audit.
The Seven Lines That Make Up One Stopped Hour
A defensible downtime cost is built from seven lines. Some will be zero at your site, and saying so explicitly is part of the exercise.
Lost contribution margin. Throughput per hour multiplied by contribution margin per unit. Only count it if the hour is genuinely unrecoverable. A plant running one shift with spare capacity often recovers the output on overtime, in which case the cost is the overtime premium, not the margin.
Idle labour and standing overhead. Fully loaded hourly cost of everyone who cannot work, including supervision. Fully loaded means salary plus statutory contributions plus transport and welfare, which typically runs 30 to 45 percent above basic pay.
Scrap, spoilage and rework. Material in process that cannot be recovered when the power stops. This is usually a fixed penalty per event rather than a rate per hour, and that distinction changes the whole calculation.
Restart energy, consumables and utilities. Purge cycles, re-warming, chemical dosing, compressed air, and the fuel burned bringing the plant back to a stable operating point.
Secondary equipment damage. An uncontrolled stop is mechanically harsher than a controlled one. Thermal shock on a steam turbine, coast down through critical speeds on a loss of lube oil pressure, and repeated hard starts on standby sets all carry a real reserve. Set it as an expected value per event rather than pretending it is zero.
Expedite, hire and logistics. Emergency generator hire, air freight on parts, and standby haulage waiting at the gate.
Contractual and customer exposure. Service level penalties, rejected deliveries, and lost slots in a customer schedule. Quantify only what is written in a contract. Anything softer belongs in a note, not in the number.
Add them and you have a cost per event and a cost per additional hour, which is not the same thing.
Three Plants, Three Very Different Downtime Costs per Hour
The figures below are hypothetical worked examples, rounded, using illustrative naira inputs. Your own numbers will differ; use your own margin, labour rate and material cost throughout. The point of showing three is that the spread between plants is far wider than most managers expect.
Hypothetical example: an oilseed crushing operation, processing 45 tonnes of seed a day across two 11 hour shifts, at an assumed contribution margin of N38,000 per tonne (use your own margin). Throughput works out to about 2.05 tonnes per hour, so the illustrative lost margin is N77,900 an hour on that assumption. Thirty four people at a fully loaded N1,100 an hour (use your own loaded labour rate) adds N37,400. The expeller cages have to be brought back to temperature and the first 25 minutes of output is recycled, adding a reprocessing and energy cost on the first hour only.
Hypothetical example: a plastics injection moulding operation, eight machines, 320 kW connected load, running a customer schedule. When supply drops without a controlled shutdown, polymer freezes in the barrels and hot runners. Purging and requalification takes 90 to 150 minutes and scraps 40 to 70 kg of resin per machine, at an assumed resin cost of N2,150 per kg (use your own delivered price). That works out to a fixed penalty near N946,000, whether the outage lasted 20 minutes or four hours.
Hypothetical example: a frozen storage facility, 900 pallet positions, holding minus 18 degrees C against a 32 degree ambient, at an assumed stock value of N783m (use your own inventory value). With doors sealed and no heat load added, the room warms slowly. Product stays within specification for several hours, then the exposure arrives all at once.
| Cost line, NGN per hour | Oilseed mill | Moulding plant | Frozen store |
|---|---|---|---|
| Lost contribution margin | 77,900 | 410,000 | 95,000 |
| Idle labour and standing overhead | 37,400 | 28,600 | 22,000 |
| Scrap and rework, first hour only | 46,000 | 946,000 | 0 |
| Restart energy and consumables | 12,000 | 74,000 | 18,000 |
| Secondary damage reserve per event | Not material | 45,000 | 30,000 |
| Expedite, hire and contract exposure | 0 | 60,000 | 0 |
| First hour total | 173,300 | 1,563,600 | 165,000 |
| Each further hour | 115,300 | 498,600 | 117,000 |
| Product at risk beyond ride-through | None | None | 45m to 78m as a step, on the assumed stock value above |
Three observations follow from that table.
The moulding plant’s cost is dominated by a fixed restart penalty, not by elapsed time. A 20 minute outage and a three hour outage differ by about N1m out of N2.6m, so its investment case is about ride-through and controlled shutdown, not repair speed.
The oilseed mill’s cost is close to linear, so its case is about mean time to repair. Spares on the shelf and a defined contractual response time move the number directly.
The frozen store example looks cheap for six hours, then becomes the most expensive of the three by two orders of magnitude. An hourly average for that plant would justify nothing and protect nothing.
Why the Fifth Hour Rarely Costs What the First Hour Cost
Thermal mass, batch structure and buffer stock decide the shape of the curve, and every plant has a different one.
Continuous plants with material in process lose most of their money in the first hour and then settle to a lower rate. Batch plants lose a whole batch or none. Plants with thermal inertia, meaning cold stores, curing ovens, digesters and heated tanks, cost almost nothing early and then step sharply once the process leaves its window.
There is a second curve running in the opposite direction. Beyond about four hours, expedite costs, emergency hire, overtime recovery and customer consequences start climbing. Where the two curves cross is where your redundancy target sits, and it is a site specific answer.
This is also where technology claims need care. Solar photovoltaic on its own does not provide ride-through, because output collapses with irradiance and it cannot hold a process through a cloud passage, let alone a night outage. Battery storage does provide ride-through, but only for the load and duration it was sized for, and sizing for a 320 kW moulding hall for two hours is a very different capital number from sizing for a 15 kW control room. A UPS on controls and a diesel set on the process is often the cheaper and more honest answer. Any of these decisions needs a measured load profile first, which is what load bank testing and a demand survey are for.
To have the ride-through and restart requirement sized against your actual process curve, book a plant assessment.
Where the Hours Actually Come From
Once the cost per hour is known, the next question is which failures are generating the hours. In our experience across Nigerian plants, the distribution is not what the maintenance budget assumes.
Grid unavailability sets the baseline. The Nigerian Electricity Regulatory Commission publishes supply and system data at nerc.gov.ng, and the World Bank Enterprise Surveys record self-reported losses from electrical outages as a share of annual sales at enterprisesurveys.org, where Nigerian figures are high by international comparison. That baseline is why you have generation on site.
The expensive hours come from the standby plant failing when it is called. The recurring causes are consistent. Fuel contamination, water and particulate from a bulk tank nobody drains, which is covered under contaminated diesel and generator damage. Sets run for years at 20 to 30 percent load that have glazed bores and carboned turbochargers and can no longer take a step load. Bearing failures on turbine sets, where a thrust or journal bearing gives warning for weeks in vibration and lube oil data before it goes, as set out in turbine bearing babbitt failure.
Then there is the line that turns a four hour repair into a six week outage. Spares lead times on turbine and large engine components are routinely 8 to 26 weeks from order, longer where the part is import dependent and FX has to clear first. A plant with a defensible cost per hour can price a critical spares holding in about five minutes, as set out in turbine spare parts lead time.
Diagnosis of a repeat failure needs an engineer on site with instrumentation, not a phone call. Vibration signatures, lube oil analysis and trend data have to be taken on the running machine, and some corrections need a planned outage window and specialist tooling.
What You Do With the Number Once You Have It
The cost per hour is not a reporting metric. It is a decision tool, and it settles four arguments that otherwise run indefinitely.
Maintenance spend. A generator maintenance programme priced against your own downtime cost pays for itself if it prevents only a handful of unplanned stops a year at the moulding plant example above. At the oilseed mill example, with a much lower cost per hour, the same programme needs to prevent many more stops to clear the same bar. Same proposal, completely different verdicts depending on which plant is asking, and both are correct.
Redundancy. Sizing N plus 1 capacity is a capital decision that is trivial to justify at N1.5m an hour and hard to justify at N165,000 an hour with a six hour ride-through.
Response time in the contract. A four hour response commitment costs more than next business day. Whether it is worth it is exactly the cost per hour multiplied by the hours saved, which is the whole basis on which a maintenance contract should be negotiated.
Outage scheduling. A planned outage taken in your low season at a known cost beats the same work forced on you in peak, and the number lets you show that in writing.
Build the figure once, put it on one page with the assumptions listed, and revise it when your product mix or margins move. Where the money goes on the maintenance side is broken down under turbine and generator maintenance cost.
If you want the costing and the reliability assessment done together, request a technical proposal. We scope the assessment first and quote the corrective work afterwards, in writing, against what the data shows.
Frequently Asked Questions
How do I calculate the cost of unplanned downtime per hour for my plant?
Take throughput per hour multiplied by contribution margin per unit, then add fully loaded idle labour, restart energy and consumables, and a per event reserve for secondary equipment damage. Handle scrap and spoilage separately as a fixed penalty per event, because it does not scale with elapsed time on most processes. Produce two figures rather than one, a first hour cost and a cost for each further hour, and list your assumptions on the same page so the number can be challenged.
Should I use revenue or profit when working out downtime cost?
Contribution margin, which is revenue less the variable costs you avoid while stopped. Using revenue overstates the loss substantially and makes every proposal look justified, which damages your credibility the first time someone checks the arithmetic. Fixed costs still run during the outage, so they belong in the idle labour and standing overhead line rather than being ignored.
What is a typical downtime cost per hour for a Nigerian factory?
There is no useful typical figure, and any consultant quoting one without seeing your process should be treated with caution. Across the hypothetical examples in this article the first hour ranged from about N165,000 to over N1.5m on the assumptions used, and the cold storage example’s exposure beyond its ride-through window was in the tens of millions. Process type, thermal inertia, batch structure and buffer stock matter far more than plant size or installed kW.
Does a standby generator remove the downtime cost entirely?
Only for outages it actually covers, and that depends on transfer time, set condition and whether the load can accept a step. Process controls and drives frequently trip on a transfer that takes several seconds, so the plant still stops even though the generator started correctly. Sets left lightly loaded for years often cannot take the step load when finally called, which is why load bank testing and a documented start reliability record matter more than the nameplate rating.